Analyze eCommerce sales funnel in Google Analytics 4
eCommerce sales funnels follow a very predictable pattern:
a user lands on the homepage
selects a product
adds it to the cart
initiates checkout
and ideally, completes the transaction
This “happy path” represents the core journey to revenue. Ensuring and monitoring that this critical path functions well is a key responsibility for any eCommerce manager.
Building detailed reports for each step of the funnel can help answer several important questions at once:
is the checkout process working properly?
where are users most likely to drop off?
are there specific dimensions—like device (mobile vs. desktop) or language—that correlate with a lower conversion rate?
Fortunately, Google Analytics 4 is well-equipped to support this kind of analysis.
Its standard eCommerce events include all the relevant steps, and when implemented correctly, GA4’s built-in Purchase Journey funnel give insights into this core sales process of every eCommerce business.
What you need?
Tracking plugin covering follow events:
view_item
add_to_cart
begin_checkout
purchase
Google Tag Manager
Google Analytics 4 property
Let's get started
Setting up your Purchase Journey funnel in GA4 doesn’t have to be complicated. Here’s how to get started and make sure everything works as it should:
Ensure all eCommerce events are tracked
First, check how you eCommerce events are tracked:
are you using a GTM tracking plugin?
do you have custom dataLayer implementation?
or direct GA4 integration?
Using a dedicated GTM plugin with good events coverage is typically the most reliable solution. In this case check plugin's settings and verify if following events are enabled:
view_itemadd_to_cart,begin_checkoutpurchase
These events are the backbone of your funnel. If you are using custom dataLayer implementation check GA4 Engagement > Events report to see if those events are showing up.
Check tags setup (GTM only)
If you are using Google Tag Manager, which is the preferred way in case of more demanding businesses you should also verify the tagging setup.
Open your GTM container and verify that all eCommerce-related tags are in place. You would either have one tag per event, or single tag that fires on multiple events. Have a quick look at the tag configuration.
Use Tag Manager Preview Mode and GA4’s DebugView to make sure data is flowing.
Enable the Purchase Journey report
As mentioned above GA4 has a built-in report called the Purchase Journey located in the Monetization section. If it's not available head to Library section and then look for Life cycle collection. Publish it and the report should appear.
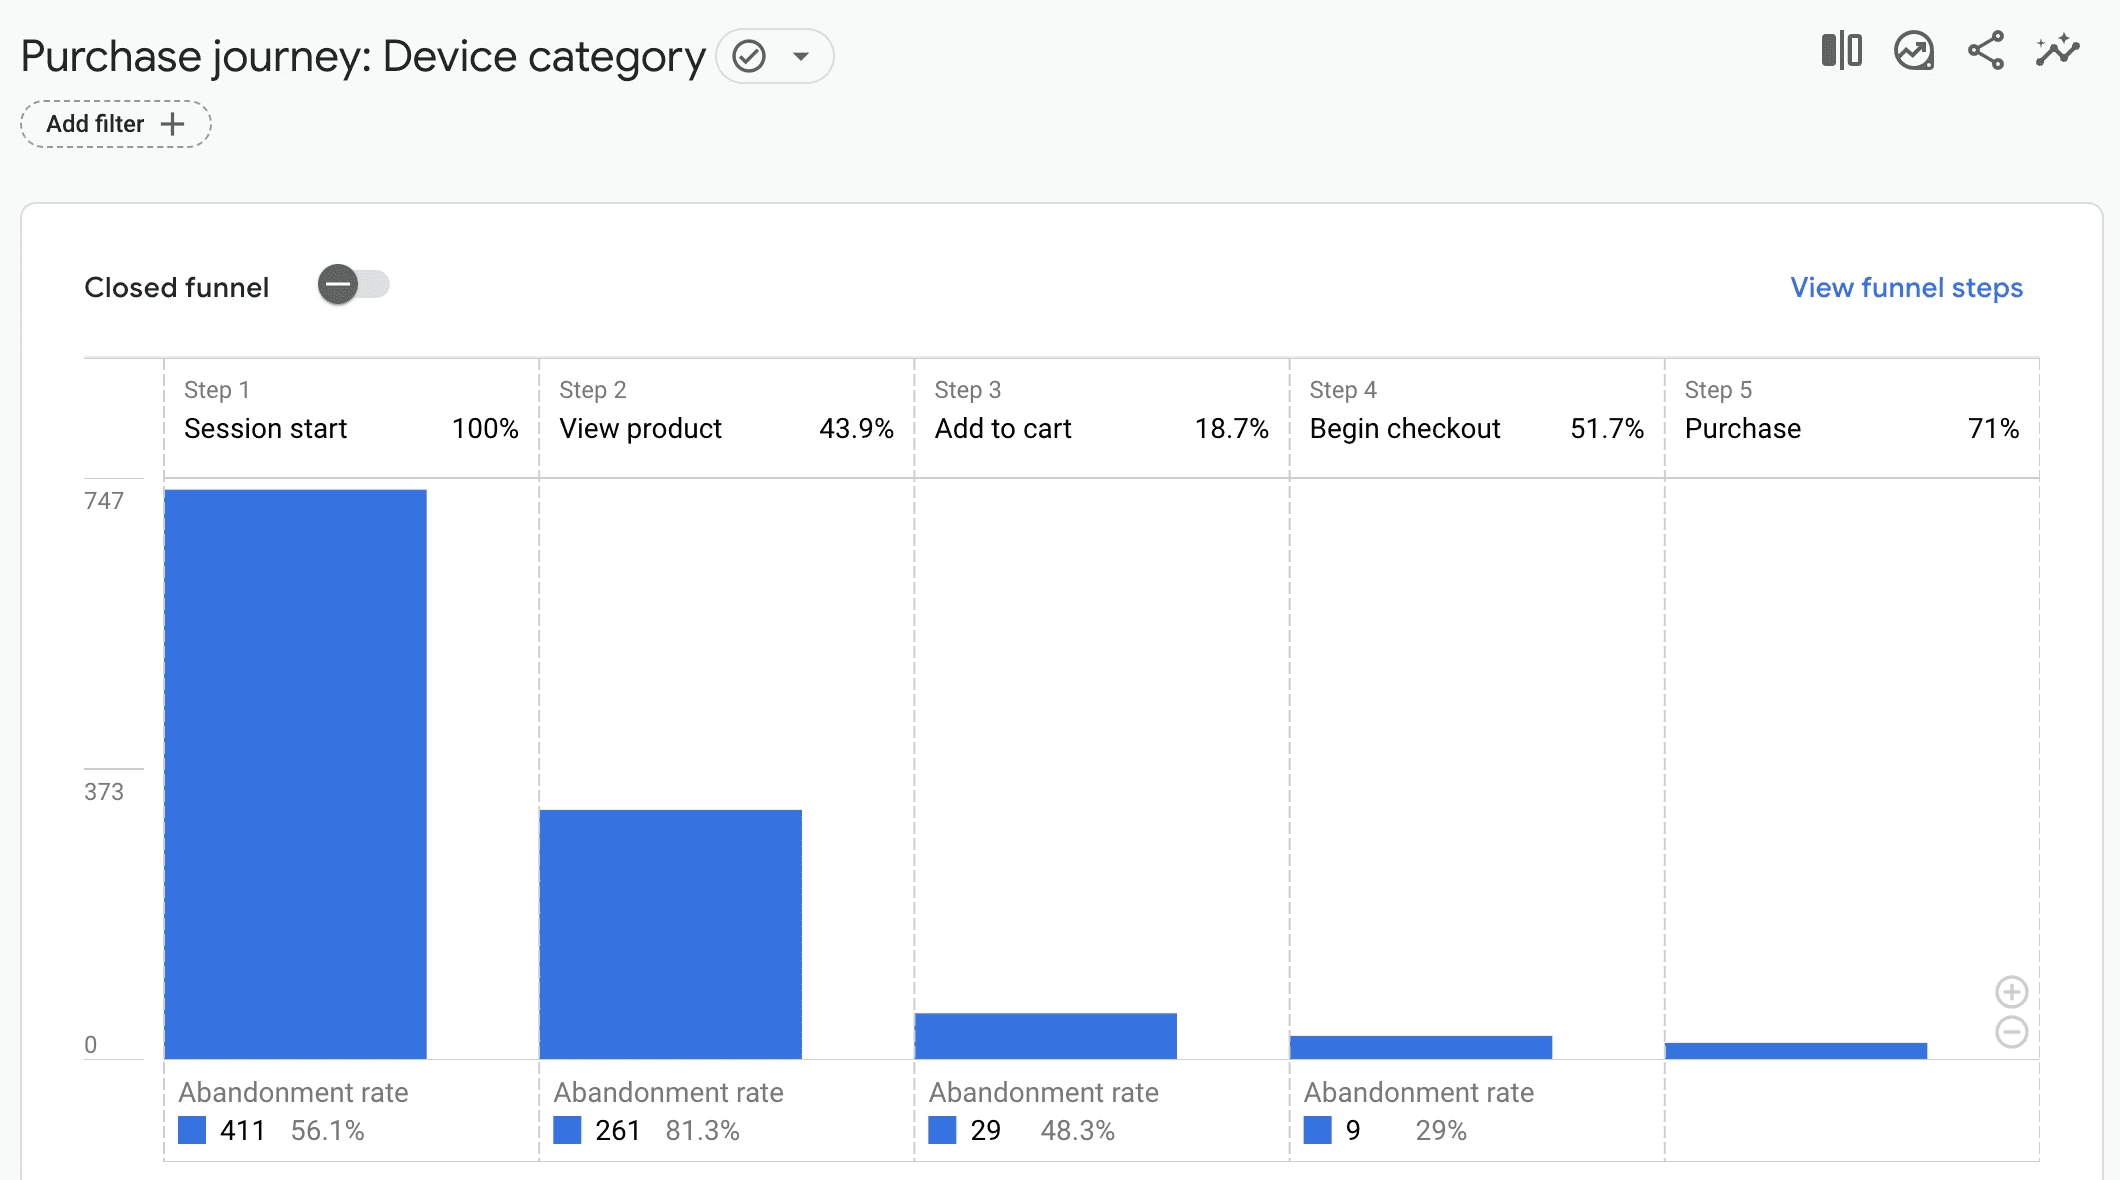
Purchase Journey funnel basics
The report shows how many active users users make it through each step of the eCommerce process. By default it is a closed funnel, which means only users who go in order through this sequence of events will appear in the report. On the other hand, changing the toggle to open funnel will allow users to appear within consecutive steps without being included in previous steps.
To recap each step represents number of users who completed it with following metrics:
active users - available when hovering over the bar, it is a total number of active users who completed the step
abandoning users - it is shown next to small blue box at the bottom of the step, it is a total number of users who abandoned this step and didn't proceed further
completion rate - percentage of users who completed this step compared to previous step
abandonment rate - percentage of users who entered this step, but who didn't completed the next step
The abandonment rate of one step and completion rate of the consecutive step is always 100%.
It is normal that final steps have very small bars on the cart, but you can zoom it in.
Detailed breakdown
I addition to the visual funnel this report features a breakdown table. It allows you to quickly compare the numbers between different groups of users. By default, the funnel is broken down by device type. Which is very useful insight to see how you funnel is performing between users visiting on mobile vs desktop.
You can easily change the breakdown dimension to other user-scoped dimensions like country or language, which is useful in case of multi-language and multi-market stores.
Limitations of the built-in report
While the Purchase Journey report is a great first step into gaining good understand of the critical eCommerce sales funnel, it has some limitations:
very limited number of available breakdown dimensions, for instance none of traffic source attribution parameters are not available
the percentages in table view shows how the number of active users in each combination of step and dimension value compares to the total, so it is not abandonment or completion rate
Some of those limitations can be addressed by creating a custom exploration based on this report. GA4 makes it very simple, with a dedicated button in top right of the screen called "Open this report as an exploration". Clicking it will create a new custom exploration with the same initial setup. From there you can customize your metrics and dimensions.
Our solution
If all of this sounds helpful but a bit overwhelming - don’t worry. As part of our monthly subscription, we offer hands-on analytics support. We’ll set up and audit your tracking, build custom reports in GA4, and help you find the real insights hiding in your data.